bandplot
Label:
- vasp
- band
- spinless
Description of the Script:
plot a band stucture of standard vasp output
Input:
- Files: POSCAR KPOINTS EIGENVAL/BAND.dat DOSCAR/Efermi
Output:
- band-structure with nice output
Note:
Change log
- Document Date: 2020/12/05
- Creation Date: 2020/12/05
- Last updated : 2020/12/05
Copyright
- parkman
- parkman@buaa.edu.cn
Let’s begin
make sure you have copy the POSCAR KPOINTS EIGENVAL DOSCAR in this directory
1ls
Result
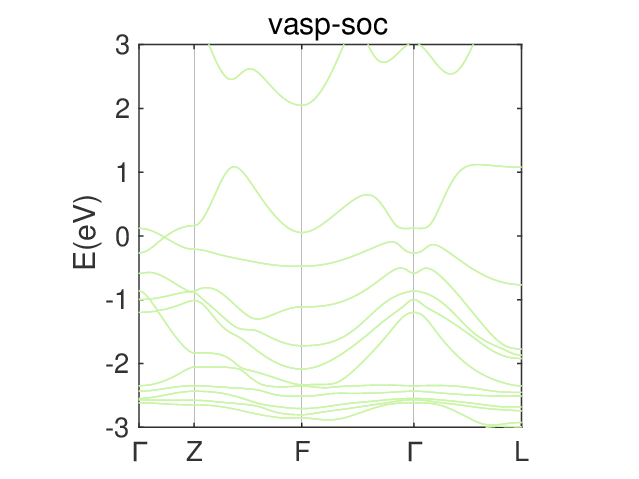
for a default print,just type
1bandplot
2% or
3bandplot()
1bandplot;

for a user-defined bandplot
we shoulf first load the EIGENCAR, EIGENCAR = EIGENVAL_read(); which is a highly useful matric stucture with the format
| kpoint1 | kpoint2 | … | kpoints | ||
|---|---|---|---|---|---|
| Band:1th | |||||
| Band:2th | |||||
| … | |||||
| Band:nth |
1EIGENCAR = EIGENVAL_read();
bandplot parm
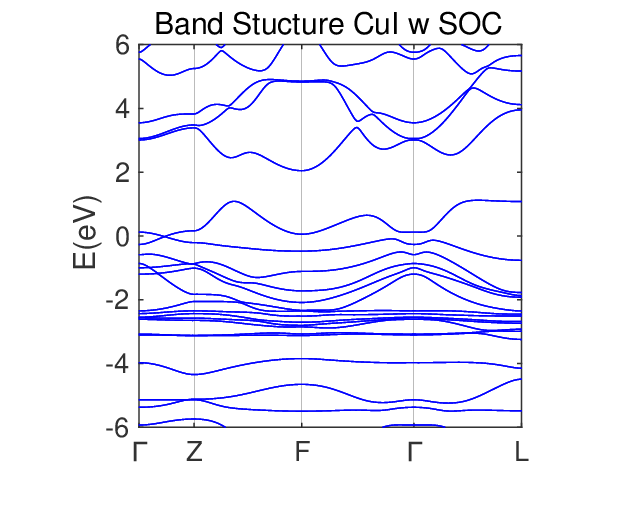
The whole parm of bandplot is [fig,ax]=bandplot(EIGENCAR,Ecut,titlestring,color,klist_l,kpoints_l,… kpoints_name,fontname,fig,ax) Here, we’d like check Ecut = [-6,6], with a title ‘Band Stucture CuI w SOC’ blue color, we just run and abtain a (title).eps file. You can open it with AI for publication
1bandplot(EIGENCAR,[-6,6],'title','Band Stucture CuI w SOC','Color','b');

save plot data
we can get handle and the plot data of a bandplot
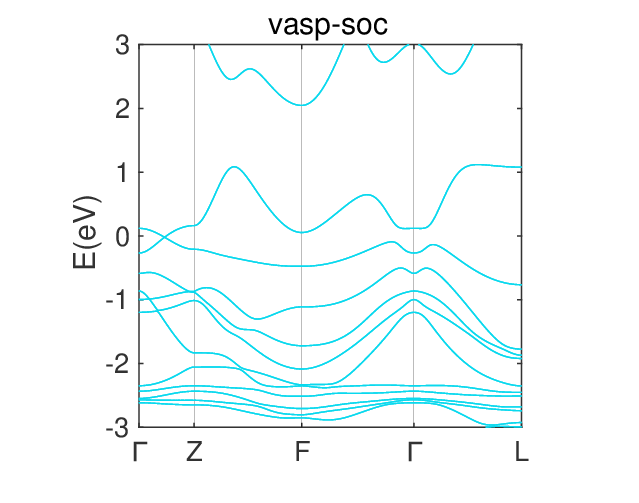
1[fig,ax,data_plot] = bandplot()

Result
fig = Figure (3) - 属性:
  Number: 3
    Name: ''
   Color: [1 1 1]
Position: [680 558 560 420]
   Units: 'pixels'
显示 所有属性
ax = Axes (vasp-soc) - 属性:
         XLim: [0 3.0451]
         YLim: [-3 3]
       XScale: 'linear'
       YScale: 'linear'
GridLineStyle: '-'
     Position: [0.1300 0.1100 0.7750 0.7993]
        Units: 'normalized'
显示 所有属性
data_plot = EIGENCAR: [48x240 double] Ecut: [-3 3] titlestring: ‘vasp-soc’ color: [0.0357 0.8491 0.9340] klist_l: [1x240 double] kpoints_l: [5x1 double] kpoints_name: [“Γ” “Z” “F” “Γ” “L”] fontname: ‘Helvetica’
Parameters
default
1bandplot(EIGENCAR,Ecut,klist_l,kpoints_l,kpoints_name,'key','value',...);
2[fig,ax] = bandplot(EIGENCAR,Ecut,klist_l,kpoints_l,kpoints_name,'key','value',...);
3[fig,ax,plot_data_collection]bandplot(EIGENCAR,Ecut,klist_l,kpoints_l,kpoints_name,'key','value',...);
EIGENCAR = EIGENVAL_read();
Ecut = [-3,3];
klist_l = [];
kpoints_l = [];
kpoints_name = [];
options.fig =  handle([]);
options.ax =  handle([]);
options.fontname = 'Helvetica';
options.KPOINTS = 'KPOINTS';
options.POSCAR = 'POSCAR';
options.Color =  @jet;
options.title = '';
options.klist_l = [];
options.kpoints_l = [];
options.kpoints_name = [];
options.xlabel='';
options.ylabel='E(eV)';
options.LineSpec = '-';
options.LineWidth = 1;
options.MarkerSize = 3;
options.MarkerEdgeColor = [];
options.MarkerFaceColor = [];

